We may encounter the following issue if we are using a system without UI (e.g. Linux, Unix):
QXcbConnection: Could not connect to display xxxxx
1
2
import matplotlibmatplotlib.use('Agg' )
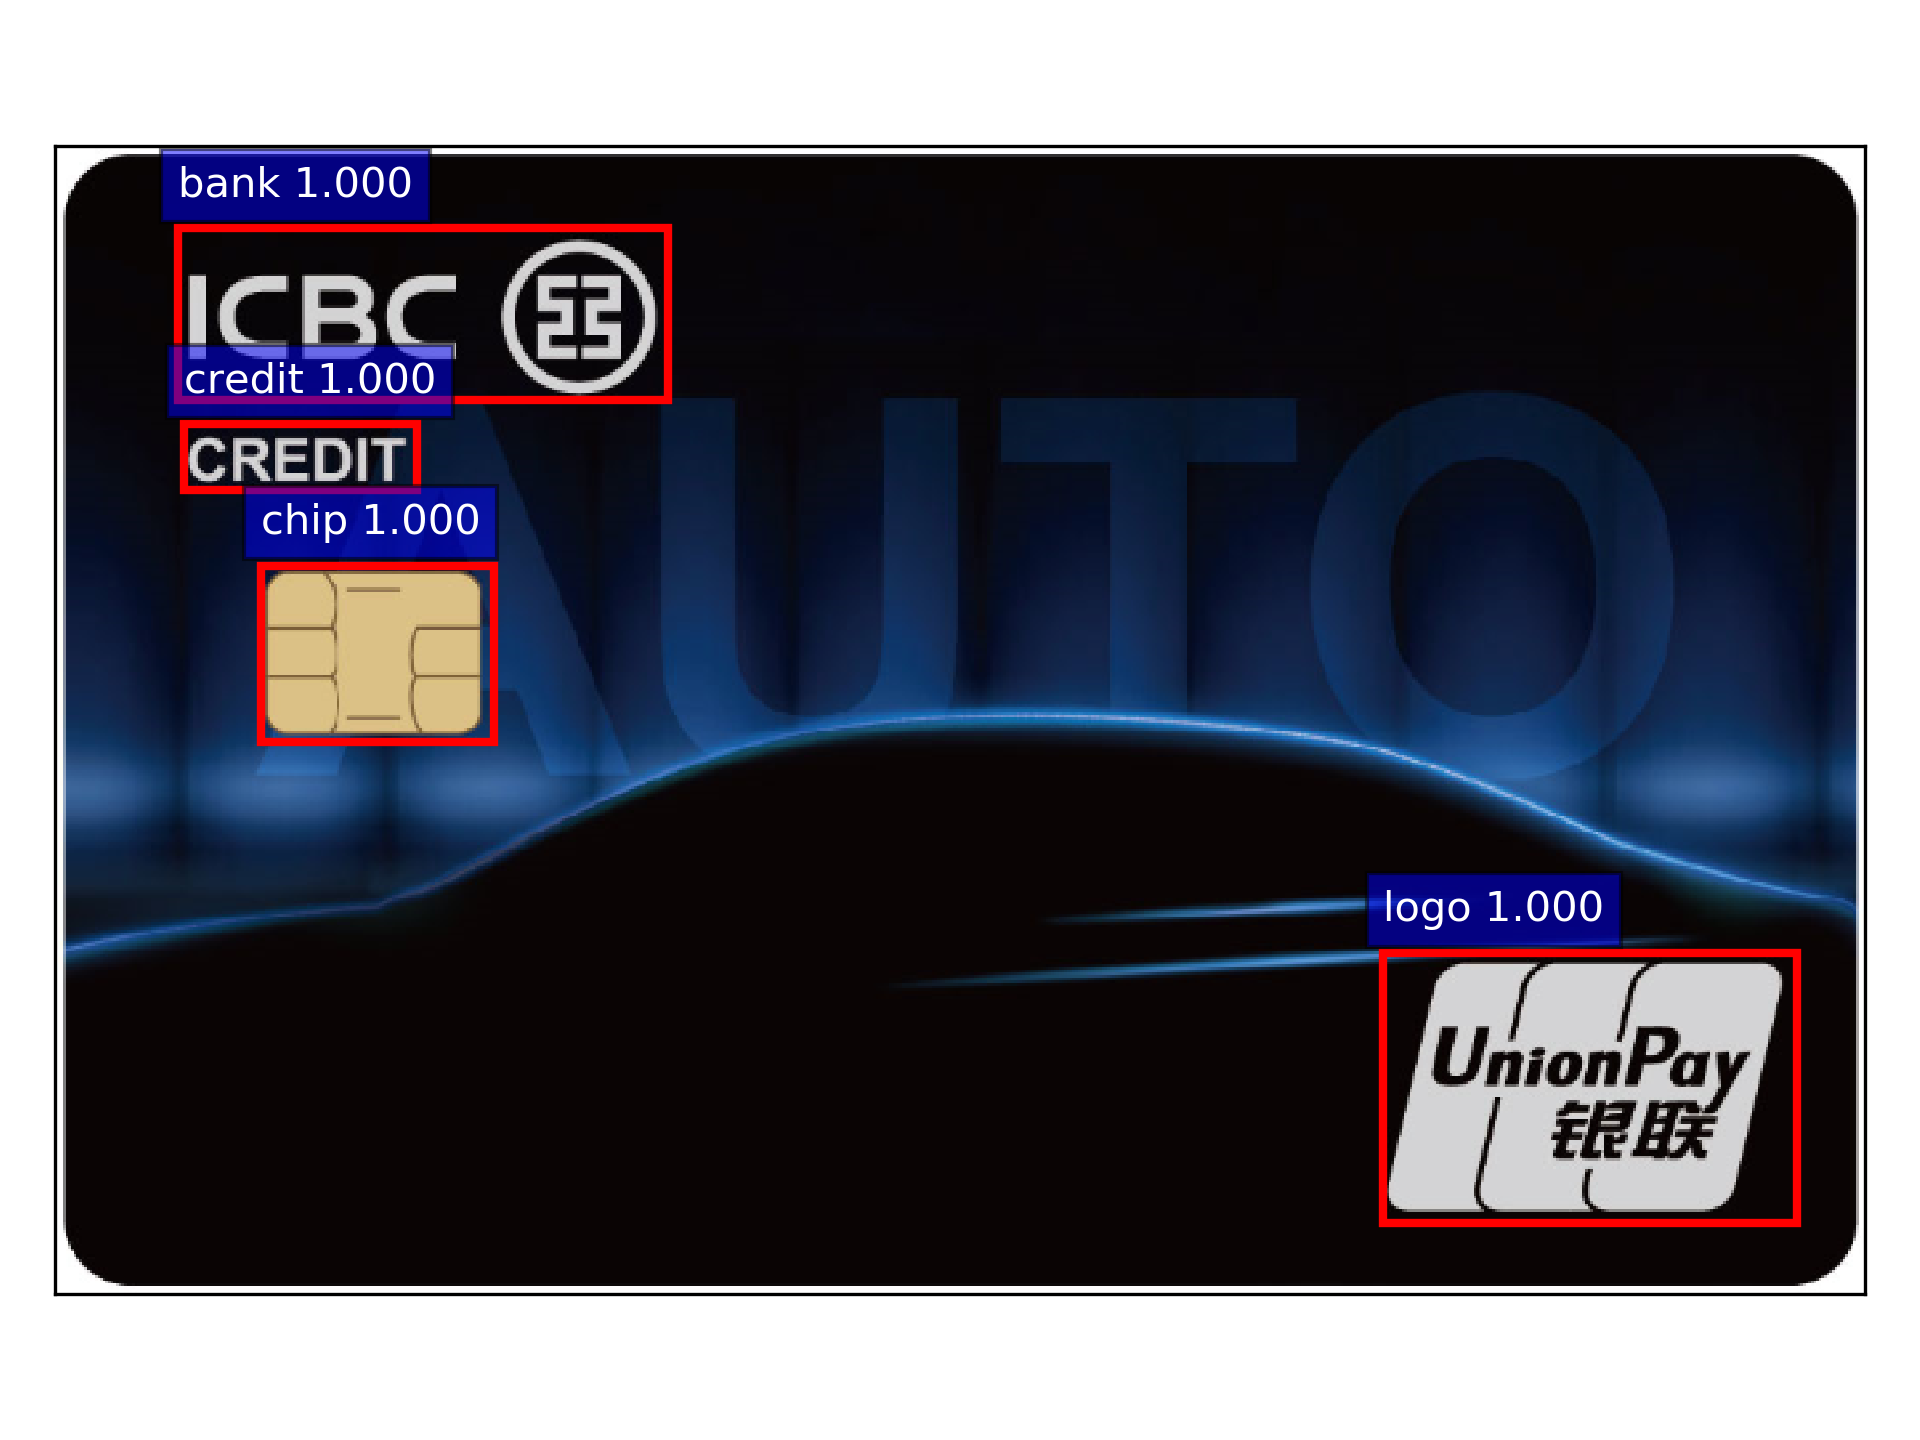
1
2
3
4
5
6
7
8
9
10
11
12
13
14
15
16
17
18
19
20
21
22
23
24
25
26
27
28
29
30
31
32
33
34
35
36
37
import matplotlib.pyplot as plydef plot (img, BBoxes, Scores, Classes ): h, w, c = img.shape fig = plt.figure() ax = fig.add_subplot(111 ) ax.imshow(img) for i in range (len (BBoxes)): bbox = BBoxes[i] bbox[0 ] = max (bbox[0 ], 0 ) bbox[1 ] = max (bbox[1 ], 0 ) bbox[2 ] = min (bbox[2 ], h) bbox[3 ] = min (bbox[3 ], w) bbox = [bbox[1 ], bbox[0 ], bbox[3 ], bbox[2 ]] score = Scores[i] cls = Classes[i] ax.add_patch( plt.Rectangle((bbox[0 ], bbox[1 ]), bbox[2 ] - bbox[0 ], bbox[3 ] - bbox[1 ], fill=False , edgecolor='red' , linewidth=2 ) ) ax.text(bbox[0 ], bbox[1 ] - 10 , '{:s} {:.3f}' .format (cls, score), bbox=dict (facecolor='blue' , alpha=0.5 ), fontsize=10 , color='white' ) plt.gca().xaxis.set_major_locator(plt.NullLocator()) plt.gca().yaxis.set_major_locator(plt.NullLocator()) plt.tight_layout() plt.margins(0 ,0 ) plt.savefig('xxxx' , dpi=200 , bbox_inches='tight' )
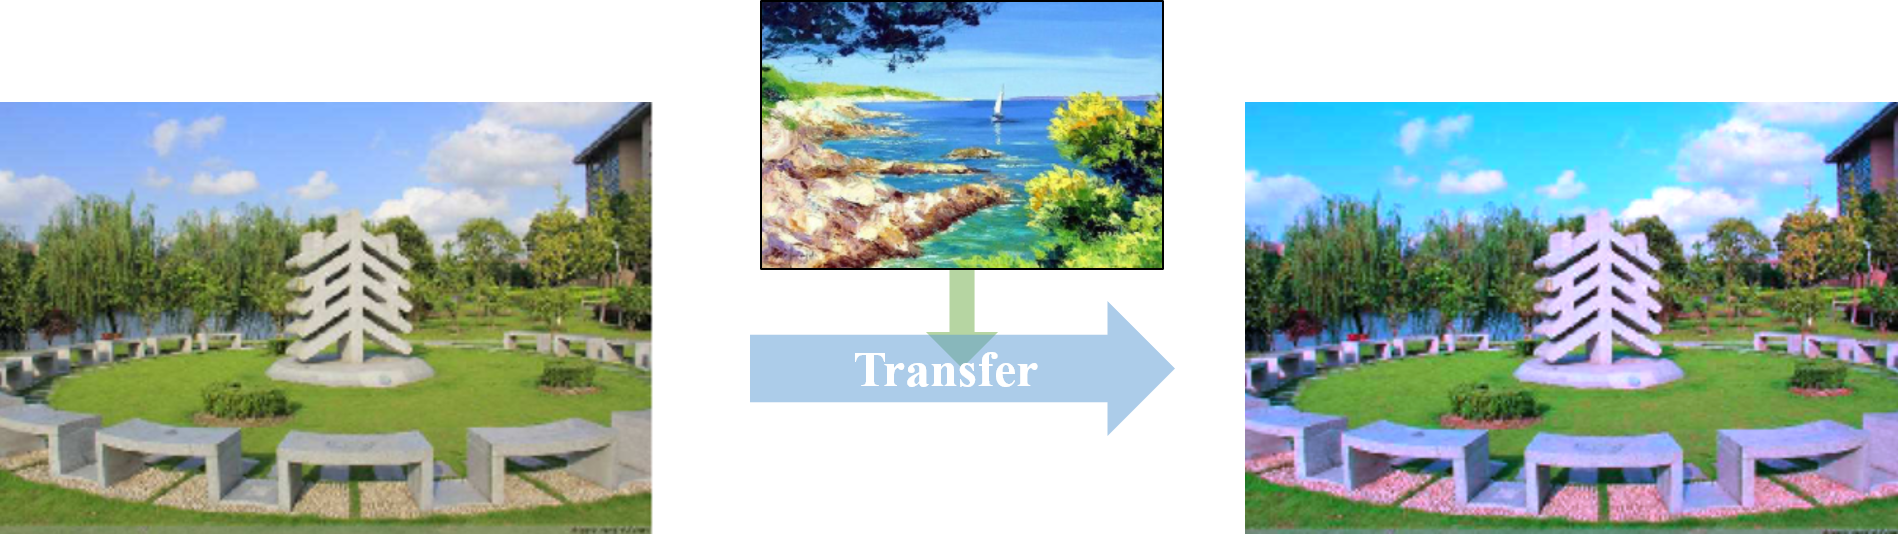
效果如图:
1
2
3
4
5
6
7
8
9
10
11
12
13
14
15
16
17
18
19
import cv2def resize_by_padding (img, height, width ): top, bottom, left, right = 0 , 0 , 0 , 0 h, w, c = img.shape longer = max (h, w) if (h < longer): dh = longer - h top = dh // 2 bottom = dh - top elif (w < longer): dw = longer - w left = dw // 2 right = dw - left BLACK = [0 , 0 , 0 ] constant = cv2.copyMakeBorder(img, top, bottom, left, right, cv2.BORDER_CONSTANT, value=BLACK) return cv2.resize(constant, (height, width))
在调用 Azure Cognitive Service 中 Vision API 的时候,我们需要把输入的图片(np.array)转换为 API 可以接受的格式(BufferedReader):
1
2
3
4
5
import cv2from io import BufferedReader, BytesIOimg = cv2.imread('xxx.jpg' ) stream = BufferedReader(BytesIO(cv2.imencode('.jpg' , legend)[1 ].tobytes()))
当我们自己写了一个 swagger API,上传图像后我们需要对图像进行处理,但是后端实际上接收到的是 FileStorage 格式,我们要将其转换为图像(np.array)才能进行处理
1
2
3
4
5
6
7
8
9
10
11
12
13
14
15
16
17
18
19
20
21
22
23
24
25
26
27
28
29
30
""" This is the OCR API Upload the barplot and return the results --- tags: - OCR API parameters: - name: img in: formData description: Upload the barplot image required: true type: file responses: 500: description: Unexpected error 200: description: The results of the barplot recognition """ import cv2import numpy as npfrom io import BufferedReader, BytesIOstream = request.files['img' ] buf = BufferedReader(stream) nparr = np.frombuffer(buf.read(), dtype=np.uint8) img = cv2.imdecode(nparr, cv2.IMREAD_COLOR)