avatar

目录
sklearn 笔记

聚类

K-Means

python
1
2
3
4
5
6
7
8
9
10
11
from sklearn.cluster import KMeans
from collections import Counter

kmeans = KMeans(n_clusters=2)
kmeans.fit(data)
label_pred = kmeans.labels_
print(np.array(label_pred[:20]))
print(Counter(label_pred))

>>> [1 1 1 1 1 1 1 0 0 0 0 0 0 0 0 0 0 0 0 1]
>>> Counter({0: 722, 1: 1686})

寻找最优聚类簇数

python
1
2
3
4
5
6
7
8
9
10
11
12
13
14
15
16
17
18
19
20
21
22
23
24
25
26
27
28
29
30
31
32
33
34
35
36
37
from sklearn.cluster import KMeans
from sklearn import metrics
from matplotlib import pyplot as plt

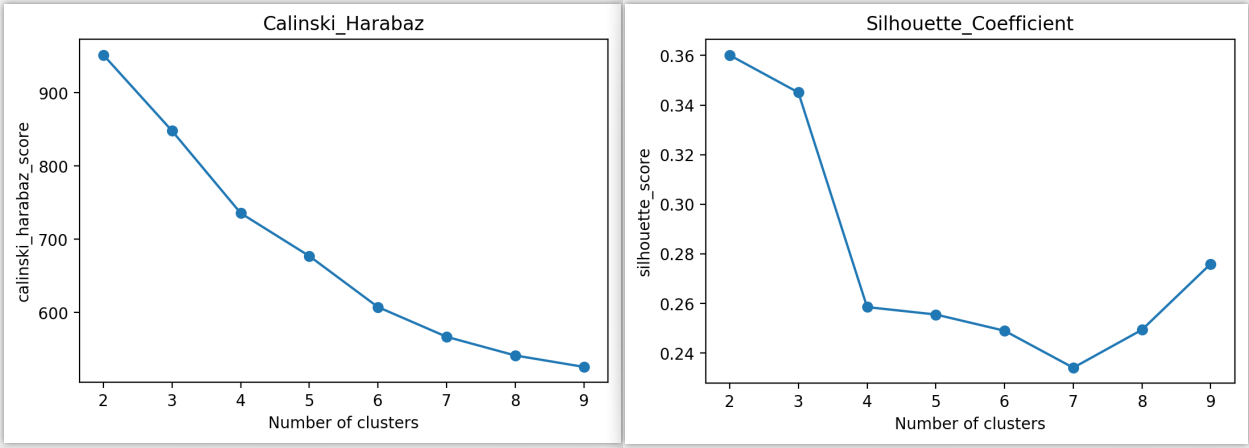
# Silhouette_Coefficient (轮廓系数) ==> 越大越好
def Silhouette_Coefficient(clusterType, data, n_clusters):
scores = []
for i in n_clusters:
if(clusterType.lower() == 'kmeans'):
model = KMeans(n_clusters=i)
model.fit(data)
scores.append(metrics.silhouette_score(data, model.labels_ , metric='euclidean'))
plt.plot(n_clusters, scores, marker='o')
plt.xlabel('Number of clusters')
plt.ylabel('silhouette_score')
plt.title('Silhouette_Coefficient')
plt.show()

# Calinski_Harabaz Index ==> 越大越好
def Calinski_Harabaz(clusterType, data, n_clusters):
scores = []
for i in n_clusters:
if(clusterType.lower() == 'kmeans'):
model = KMeans(n_clusters=i)
model.fit(data)
scores.append(metrics.calinski_harabaz_score(data, model.labels_))
plt.plot(n_clusters, scores, marker='o')
plt.xlabel('Number of clusters')
plt.ylabel('calinski_harabaz_score')
plt.title('Calinski_Harabaz')
plt.show()

# ===========================================================================================

# 通过轮廓系数和Calinski_Harabaz Index寻找最优聚类簇数(都是越大越好)
Silhouette_Coefficient('kmeans', data, range(2, 10))
Calinski_Harabaz('kmeans', data, range(2, 10))

DBSCAN

python
1
2
3
4
5
6
7
8
9
10
11
12
13
14
15
16
17
18
19
20
21
22
23
24
25
26
27
28
29
30
31
32
33
34
35
36
37
38
39
40
41
42
43
44
45
46
from sklearn.cluster import DBSCAN
from sklearn import metrics
import pandas as pd

# 寻找最优参数:eps, min_samples
def DBSCAN_tune(data, epsList, minList):
results = []
for eps in epsList:
for min_samples in minList:
try:
dbscan = DBSCAN(eps=eps, min_samples=min_samples)
dbscan.fit(data)
labels = dbscan.labels_
n_clusters = len(set(labels)) - (1 if -1 in labels else 0)
outliers = len(labels[labels[:] == -1])
noiseRatio = outliers / len(labels)
counter = Counter(labels)
silhouette = metrics.silhouette_score(data, labels)
v_measure = metrics.v_measure_score(labels, totalLabel)
results.append({'eps':eps, 'min_samples':min_samples, 'n_clusters':n_clusters,
'n_outliers':outliers, 'noiseRatio':noiseRatio, 'distribution':counter,
'silhouette':silhouette, 'v_measure':v_measure})
except:
print(eps, min_samples)
df = pd.DataFrame(results)
return df

# ===========================================================================================

statistics = DBSCAN_tune(data, epsList=np.arange(0.1, 5, 0.05), minList=range(2, 15))
tmp = statistics[statistics['n_clusters'] == 3] # 寻找簇为3的结果
tmp.sort_values(['v_measure'], ascending=False) # 按照V-measure(越大越好)降序排列,找到最优参数
tmp.sort_values(['silhouette'], ascending=False) # 按照silhouette轮廓系数(越大越好)降序排列,找到最优参数

db = DBSCAN(eps=opt_eps, min_samples=opt_minsamples)
db.fit(data)
labels = db.labels_
ratio = len(labels[labels[:] == -1]) / len(labels)
print('Noise ratio : {:.4f}%'.format(ratio))
n_clusters_ = len(set(labels)) - (1 if -1 in labels else 0)
print('Num clusters : {}'.format(n_clusters_))
print('Silhouette_Coefficient : {}'.format(metrics.silhouette_score(data, labels)))

>>> Noise ratio : 0.1615%
>>> Num clusters : 13
>>> Silhouette_Coefficient : 0.21903867779598668

T-SNE降维 + 聚类结果可视化

python
1
2
3
4
5
6
7
8
9
10
11
12
13
14
15
16
17
18
19
20
21
22
23
24
25
26
27
from sklearn.manifold import TSNE
import pandas as pd

def get_tsne(data, dim=2):
tsne = TSNE(n_components=dim)
_ = tsne.fit_transform(data)
return tsne

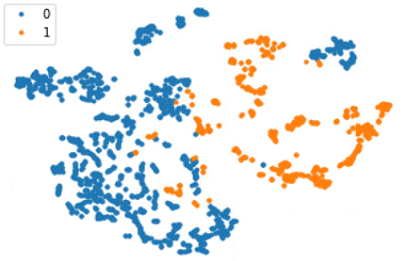
def plot_tsne(tsne, label, title=''):
tsneDF = pd.DataFrame(tsne.embedding_)
tsneDF['label'] = label
n_clusters = len(set(label))

for i in range(n_clusters):
d = tsneDF[tsneDF['label'] == i]
plt.plot(d[0], d[1], '.', label=str(i))

plt.legend()
plt.xticks([])
plt.yticks([])
plt.title(title)
plt.show()

# ===========================================================================================

tsne = get_tsne(data)
plot_tsne(tsne, label, 'title')

分类

SVM

python
1
2
3
4
5
6
7
8
9
10
11
12
13
14
from sklearn import svm

classifier = svm.SVC(C=2,
kernel='rbf',
gamma=10,
decision_function_shape='ovr',
probability=True)
classifier.fit(trainData, trainLabel)
preds = classifier.predict(testData) # 直接输出预测结果
pred_probs = classifier.predict_proba(testFeat) # 输出预测概率
print("训练集准确率:",classifier.score(trainData,trainLabel))
print("测试集准确率:",classifier.score(testData,testLabel))
>>> 训练集准确率: 1.0
>>> 测试集准确率: 0.984334203655

评估指标

Confusion Matrix(混淆矩阵)

python
1
2
3
4
5
6
7
8
9
10
11
from sklearn.metrics import confusion_matrix
import seaborn as sns

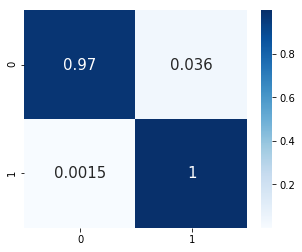
cm = confusion_matrix(testLabel, preds)
print('Confusion matrix:\n{}'.format(cm))

>>> Confusion matrix:
>>> [[387 284]
>>> [285 193]]

sns.heatmap(cm / np.sum(cm, 1), annot=True, cmap=plt.cm.Blues, annot_kws={'size':15})

Precision、Recall、F1-score(P、R、F1)

python
1
2
3
4
5
6
7
8
9
10
11
12
from sklearn.metrics import classification_report

print("PR:\n{}".format(
classification_report(testLabel, preds, target_names=['standing', 'lying'])))

>>> PR:
>>> precision recall f1-score support
>>>
>>> standing 1.00 0.97 0.99 672
>>> lying 0.97 1.00 0.98 477
>>>
>>> avg / total 0.98 0.98 0.98 1149

保存模型

python
1
2
3
4
5
from sklearn.externals import joblib

model = xxxxx
model.fit(X)
joblib.dump(model, 'path/to/save')

加载模型

python
1
2
3
from sklearn.externals import joblib

model = joblib.load('path/to/model')
文章作者: Reborn
文章链接: https://reborn8888.github.io/2020/02/14/sklearn%E7%AC%94%E8%AE%B0/
版权声明: 本博客所有文章除特别声明外,均采用 CC BY-NC-SA 4.0 许可协议。转载请注明来自 Reborn
打赏
  • 微信
    微信
  • 支付寶
    支付寶

评论